Filtering in Pandas is crucial for managing and analyzing complex datasets, as it allows you to isolate specific subsets of data that meet various conditions. In real-world scenarios, datasets can be enormous and contain a myriad of features, making it essential to query them effectively to extract meaningful insights. For instance, when working with sales data from a large retail company, a data analyst might need to investigate transactions that occurred within a specific time frame, involved certain products, or were made by specific customer demographics. By leveraging filtering, users can harness the immense power of Pandas to navigate and manipulate their data in a targeted manner, thus enhancing their analysis.
Consider a scenario involving a customer dataset with numerous attributes such as age, purchase frequency, and location. Imagine you want to extract data for customers who are between the ages of 18 and 35 and live in urban areas. Without proper filtering techniques, your analysis could be muddled with irrelevant entries, making it difficult to derive conclusions or formulate strategic recommendations. By applying filters, like combining multiple conditions using the & operator, you can efficiently curate the dataset to focus solely on that age group from urban locales. This streamlined approach not only reduces noise but also empowers data scientists to develop more tailored marketing strategies or product recommendations.
Moreover, filtering enhances the ability to conduct exploratory data analysis (EDA) by enabling pivoting on various perspectives of data. Suppose you’re analyzing a company’s employee performance dataset and want to identify employees who exceed performance metrics by a specific threshold while also belonging to particular departments. With filtering, you can carry out such advanced filtering easily and view correlations, trends, or any anomalies present within those subsets. For example a user could swiftly pull results of all employees exceeding their targets along with their performance scores and managers’ departments in one go. This capability to drill down into complex conditions not only improves the efficiency of data insights but also fosters more informed decision-making across various business functions.
In a way you know already how to carry out some important data filtering and selection operations. In Section 5.2.5 and Section 5.2.6 you have practiced how to select specific columns or rows in a DataFrame using DataFrame.loc[] and DataFrame.iloc[] operators. In Section 6.2 you have processed processed DataFrames using DataFrame.groupby().
In this chapter we will further explore how to formally define and apply filtering conditions to a Pandas DataFrame.
7.1 Boolean Operations on Pandas
Remember those comparison and logical operators from Section 3.1.3 ? They can be applied to Pandas DataFrames as well.
The following example illustrates the output of the boolean operator == applied to the column Region of the DataFrame corporatesales. We observe that the output is True for observations from the ’North’region and False otherwise.
Boolean operators provide almost endless possibilities to select observations from a DataFrame, the following table lists some common boolean operations.
Boolean Operation
Description
DataFrame['Column'] == 5
Returns True if the value in Column is equal to 5
DataFrame['Column'] != 5
Returns True if the value in Column is not 5
DataFrame['Column'] > 20
Returns True if the value in Column is larger than 20
DataFrame['Column'] >= 20
Returns True if the value in Column is equal or larger than 20
DataFrame['Column'] == 'Dorothy'
Returns True if the value in Column is equal to Dorothy
Following up on our previous example, the following boolean operation returns True if Sales are larger than 220 and False otherwise.
Pandas based data filtering is performed by combining boolean operators described in the previous section with the slicing operator [] to extract the rows fulfilling the boolean condition, refer to the following figure.
Filtering Operation
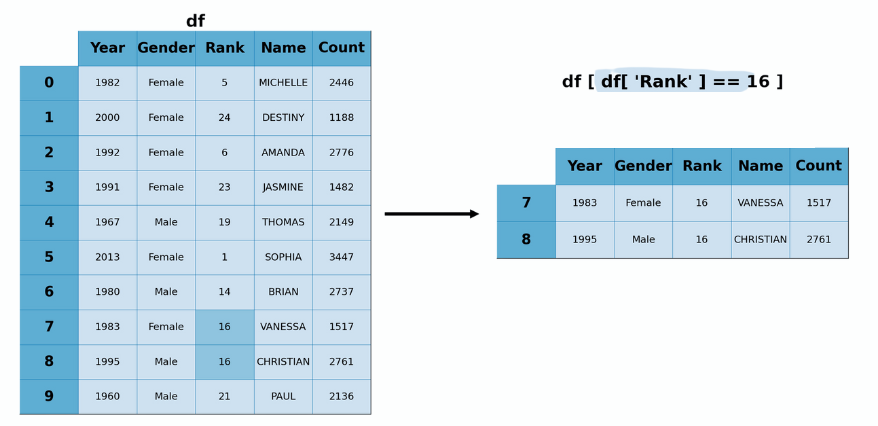
The following figure illustrates a data filtering operation that:
Defines a boolean condition df['Rank']==16 that returns true if the observation has a Rank value equal to 16.
Using the slicing operator [], it applies the boolean condition to the Dataframe df to extract the rows fulfilling the boolean condition.
Filtering Operation Example
The code required to implement this filtering operation is:
# We apply the filter to the dataframe to extract the observations fulfilling the filterdf[rankfilter]
Year
Gender
Rank
Name
Count
7
1983
Female
16
Vanessa
1517
8
1995
Male
16
Christian
2761
7.3 Composite Filtering Operations
It is quite common to define more complex filtering conditions by combining boolean conditions. To do so we rely on logical operators & and |.
By way of composite filtering you can develop advanced computational logic such as filtering based on several attributes, filtering based on a time window, filtering based on values of other columns.
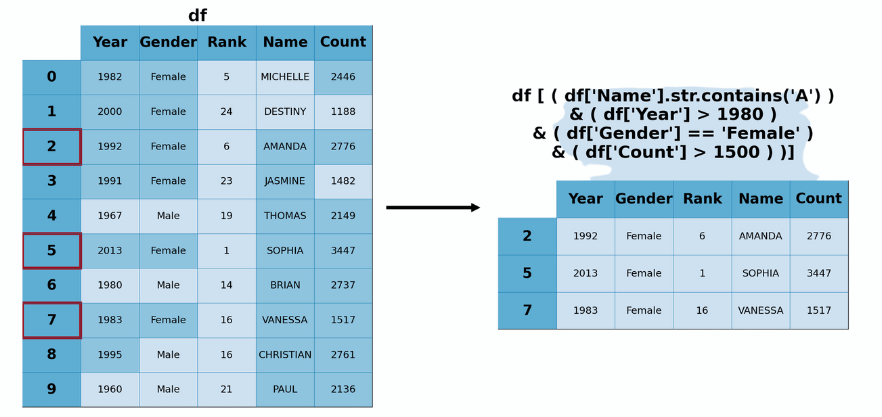
The following figure illustrates a composite data filtering operation that:
Defines four boolean conditions df['Gender']=='Female', df['Name'].str.contains('A'), df['Year']>1980, df['Content']>1500.
Using the logical operator & we combine the previous boolean conditions into a composite condition that returns True if ALL boolean conditions have returned True.
Using the slicing operator [], it applies the composite condition to the Dataframe df to extract the rows fulfilling the composite condition.
Filtering Operation Example
The code required to implement this composite filtering operation is:
# We define the filtersgenderFilter=df['Gender']=="Female"letterAFilter=df['Name'].str.contains('a')yearFilter=df['Year']>1980countFilter=df['Count']>1500# We define the composite filtercompositefilter = genderFilter & letterAFilter & yearFilter & countFilter#we observe that for rows having Rank equal to 16 the filter returns truecompositefilter
# We apply the composite filter to the dataframe to extract the observations fulfilling the filterdf[compositefilter]
Year
Gender
Rank
Name
Count
2
1992
Female
6
Amanda
2776
5
2013
Female
1
Sophina
3447
7
1983
Female
16
Vanessa
1517
7.4 Code Interpretation Challenge
Following please find some examples of python code. Try to understand what the code is trying to accomplish before checking the solution below:
Example: Filtering Heavy Penguins
import pandas as pd# Load the penguins dataseturl ="https://raw.githubusercontent.com/thousandoaks/Python4DS-I/refs/heads/main/datasets/penguins.csv"penguins = pd.read_csv(url)heavy_penguins = penguins[penguins['body_mass_g'] >4000]display(heavy_penguins.head())
Explanation:
This code groups the dataset by the species column and then calculates the mean of the body_mass_g column for each species. The groupby() function creates groups based on unique species, and the mean() function computes the average body mass within each group. The result is a Series object displaying the average body mass for each penguin species.
species
island
bill_length_mm
bill_depth_mm
flipper_length_mm
body_mass_g
sex
7
Adelie
Torgersen
39.2
19.6
195.0
4675.0
MALE
9
Adelie
Torgersen
42.0
20.2
190.0
4250.0
NaN
14
Adelie
Torgersen
34.6
21.1
198.0
4400.0
MALE
17
Adelie
Torgersen
42.5
20.7
197.0
4500.0
MALE
19
Adelie
Torgersen
46.0
21.5
194.0
4200.0
MALE
Example: Filtering Large Penguins
import pandas as pd# Load the penguins dataseturl ="https://raw.githubusercontent.com/thousandoaks/Python4DS-I/refs/heads/main/datasets/penguins.csv"penguins = pd.read_csv(url)flipper_range_penguins = penguins[(penguins['flipper_length_mm'] >=180) & (penguins['flipper_length_mm'] <=200)]display(flipper_range_penguins.head())
Explanation:
This code filters the penguins dataset to include only those with flipper_length_mm between 180 and 200 mm. The & (AND) operator ensures both conditions must be met simultaneously.
species
island
bill_length_mm
bill_depth_mm
flipper_length_mm
body_mass_g
sex
0
Adelie
Torgersen
39.1
18.7
181.0
3750.0
MALE
1
Adelie
Torgersen
39.5
17.4
186.0
3800.0
FEMALE
2
Adelie
Torgersen
40.3
18.0
195.0
3250.0
FEMALE
4
Adelie
Torgersen
36.7
19.3
193.0
3450.0
FEMALE
5
Adelie
Torgersen
39.3
20.6
190.0
3650.0
MALE
Example: Filtering Female Penguins
import pandas as pd# Load the penguins dataseturl ="https://raw.githubusercontent.com/thousandoaks/Python4DS-I/refs/heads/main/datasets/penguins.csv"penguins = pd.read_csv(url)female_adelie_penguins = penguins[(penguins['species'] =='Adelie') & (penguins['sex'] =='FEMALE')]display(female_adelie_penguins.head())
Explanation:
Here, the Boolean condition checks for two criteria using the & (AND) operator: • The species column must equal ‘Adelie’. • The sex column must equal ‘Female’.
This condition filters the dataset to include only female Adelie penguins. The parentheses around each condition ensure proper order of evaluation.
species
island
bill_length_mm
bill_depth_mm
flipper_length_mm
body_mass_g
sex
1
Adelie
Torgersen
39.5
17.4
186.0
3800.0
FEMALE
2
Adelie
Torgersen
40.3
18.0
195.0
3250.0
FEMALE
4
Adelie
Torgersen
36.7
19.3
193.0
3450.0
FEMALE
6
Adelie
Torgersen
38.9
17.8
181.0
3625.0
FEMALE
12
Adelie
Torgersen
41.1
17.6
182.0
3200.0
FEMALE
Example: Filtering Penguins based on location
import pandas as pd# Load the penguins dataseturl ="https://raw.githubusercontent.com/thousandoaks/Python4DS-I/refs/heads/main/datasets/penguins.csv"penguins = pd.read_csv(url)torgersen_biscoe_penguins = penguins[(penguins['island'] =='Torgersen') | (penguins['island'] =='Biscoe')]display(torgersen_biscoe_penguins.sample(5))
Explanation:
In this example, the Boolean operation filters rows where the island column matches either ‘Torgersen’ OR ‘Biscoe’ using the | (OR) operator. This allows us to include penguins from both islands.
species
island
bill_length_mm
bill_depth_mm
flipper_length_mm
body_mass_g
sex
267
Gentoo
Biscoe
50.5
15.9
225.0
5400.0
MALE
120
Adelie
Torgersen
36.2
17.2
187.0
3150.0
FEMALE
305
Gentoo
Biscoe
50.8
17.3
228.0
5600.0
MALE
2
Adelie
Torgersen
40.3
18.0
195.0
3250.0
FEMALE
252
Gentoo
Biscoe
45.1
14.5
207.0
5050.0
FEMALE
Example: Filtering Missing Values
import pandas as pd# Load the penguins dataseturl ="https://raw.githubusercontent.com/thousandoaks/Python4DS-I/refs/heads/main/datasets/penguins.csv"penguins = pd.read_csv(url)penguins_missing = penguins[penguins['sex'].isnull()]display(penguins_missing)
Explanation:
The code identifies rows where the sex column contains missing values (NaN) by applying the isnull() method, which returns a Boolean mask indicating whether values are missing. The rows with missing values in the sex column are filtered using Boolean indexing and stored in a new DataFrame called penguins_missing. This approach is useful for handling missing data, allowing analysts to inspect incomplete records and take appropriate action such as imputation or removal.
species
island
bill_length_mm
bill_depth_mm
flipper_length_mm
body_mass_g
sex
3
Adelie
Torgersen
NaN
NaN
NaN
NaN
NaN
8
Adelie
Torgersen
34.1
18.1
193.0
3475.0
NaN
9
Adelie
Torgersen
42.0
20.2
190.0
4250.0
NaN
10
Adelie
Torgersen
37.8
17.1
186.0
3300.0
NaN
11
Adelie
Torgersen
37.8
17.3
180.0
3700.0
NaN
47
Adelie
Dream
37.5
18.9
179.0
2975.0
NaN
246
Gentoo
Biscoe
44.5
14.3
216.0
4100.0
NaN
286
Gentoo
Biscoe
46.2
14.4
214.0
4650.0
NaN
324
Gentoo
Biscoe
47.3
13.8
216.0
4725.0
NaN
336
Gentoo
Biscoe
44.5
15.7
217.0
4875.0
NaN
339
Gentoo
Biscoe
NaN
NaN
NaN
NaN
NaN
7.5 Data Filtering in practice
7.5.1 First Example
The following Jupyter Notebook illustrates how to define and apply basic filters to the titanic dataset for the purposes of extracting a subset of the population based on age and outcome of the shipwreck (survived/perished). This would allow us, for instance, to explore the impact of age on survival.
Using Generative AI for coding purposes
In the previous example try the following prompt on Google Gemini:
“Filter rows with Name having Thomas in it”
Execute the code provided by Gemini, did it work?
7.5.2 Second Example
The following Jupyter Notebook illustrates the process of defining and applying filters to the gapminder dataset to extract observations based on country and year. The ability to filter observations based on temporal characteristics is quite useful, for instance, in econometric analysis as it allows to measure the impact of events on the economy. In Pandas this is done by defining a filter that splits the dataset into “before-the-event” and “after-the-event” and subsequently performs some statistical analysis over them.
Challenge yourself by developing code to provide insights on the following question: How has life expectancy evolved in China?
Code
# We filter by country=='Chine'chinaFilter=gapminderDataFrame['country']=='China'chinaFiltergapminderDataFrame[chinaFilter]
Using Generative AI for coding purposes
We haven’t learned how to visualize data just yet, however you can try to plot the evolution of life expectancy in China by submitting the following prompt to Google Gemini:
“plot life expectancy evolution of china”
Hopefully it will return working code you can use
7.5.3 Third Example
The following Jupyter Notebook provides examples of data selection, data grouping and data filtering in a healthcare context. Please execute the code making sure that you understand how it works and the logic behind the analysis.
Once you have understood the code provided try to develop new code to answer the following: Which Revenue Codes have the largest Average Total Expenses? Try to work it out on your own before checking the solutions below (Tip: consider the DataFrame.sort_values() method)
Code
# We group the dataset by RevenueCode, we apply mean() to the column TotalExpensestotalexpensesbyRevenueCode=HealthCareDataSet.groupby('RevenueCode')['TotalExpenses'].mean()# We sort the result in descending ordertotalexpensesbyRevenueCode.sort_values(ascending=False)
Using Generative AI for coding purposes
In the previous example try the following prompt on Google Gemini:
“Compute the mean of total expenses accross revenuecode, sort it in descending order”
Worked like a charm, didn’t it ?
Now for another challenge, try to develop code for the following question: Which Medical events lasted longer than 1 week? Again try to work it out on your own before checking the solutions below (Tip: review the following Documentation to see how to extract days from a series of datetime objects )
Code
# we create a new column 'Duration' contaning the days of hospitalizationHealthCareDataSet['Duration']=HealthCareDataSet['EndDate']-HealthCareDataSet['StartDate']# Prior to filtering we need to cast datetime objects into integer onesHealthCareDataSet['Days']=HealthCareDataSet['Duration'].dt.days# We extract rows having 'Days' larger than 7HealthCareDataSet[HealthCareDataSet['Days']>7]
Using Generative AI for coding purposes
In the previous example try the following prompt on Google Gemini:
“Which Medical events lasted longer than 1 week ?”
Hopefully it will return working code that is similar to what you developed on your own
7.6 Conclusion
This chapter delves into the essential skill of filtering in Pandas, which enables users to isolate and analyze specific subsets of data based on defined conditions. Filtering proves invaluable in managing large and complex datasets, such as identifying specific customer demographics, transaction details, or employee performance metrics. By leveraging boolean operations and logical operators like & and |, users can create precise filters for targeted data analysis, thus enhancing the relevance and clarity of insights. Boolean comparisons, such as checking if values in a column meet certain conditions (e.g., ==, >, or <), are the foundation of filtering. When combined with slicing [], these boolean conditions allow users to extract only the rows of interest from a DataFrame, significantly improving data processing efficiency.
The chapter also introduces the concept of composite filtering, which combines multiple boolean conditions to handle more complex scenarios. For instance, users can filter data based on multiple attributes simultaneously, such as gender, name patterns, year thresholds, or numeric values. This capability enables more advanced analyses, such as identifying specific trends, anomalies, or subsets of interest. Practical applications are explored through examples like filtering the Titanic dataset to analyze survival rates by age and creating temporal filters for econometric studies.
7.7 Further Readings
For those of you in need of additional, more advanced, topics please refer to the following references: